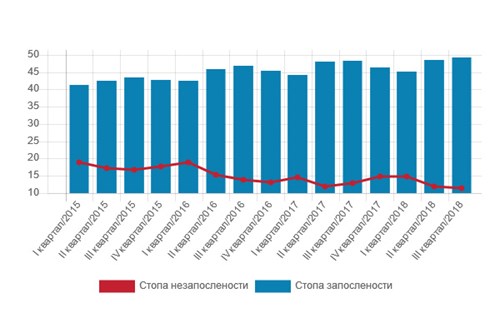
Presentation of data using interactive charts is an efficient way of showing statistical data directly from the dissemination database. Interactive charts illustrate, in a simple manner, time indices, time series dynamics’ indicators, trends, cyclical variations, etc.
Infographics (static and dynamic) is used to display multidimensional characteristics of statistical phenomena from various statistical domains.